ProECU Tuning Overview
- Brandyn Mowat

Using ProECU
Opening and Viewing a ROM File
Opening a ROM File
To open a ROM file, select 'Open ROM File…' from the 'File' menu, and select the ROM file that you wish to use: 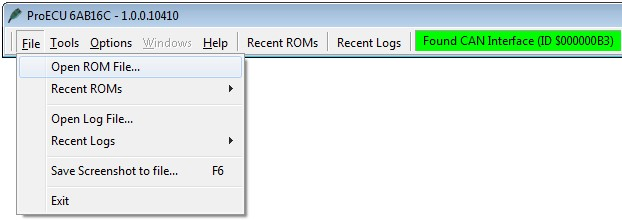
Re-opening a ROM File
After a ROM file has been opened once, its filename is remembered for later. This allows the file to be quickly re-opened from the 'Reopen ROM File' submenu
This submenu will hold a maximum of ten (10) previously opened files. This can be very helpful in making new files quickly by using data from ROM files that you have previously created.
Once a ROM file has been selected and opened, the ROM editor window will be displayed.
NOTE: Windows 7 will also show the last opened ROMs in the taskbar: 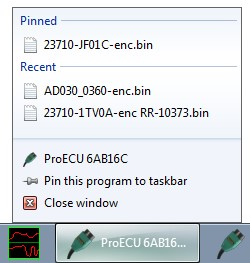
ROM Structure
A single ROM file is presented as a number of maps. These maps contain the data that the ECU uses to choose values for engine parameters such as ignition timing, fuelling and rev limiting. The different types of map within each ECU ROM file are described below:
User Level
As confidence is gained with the software, and the tuner wishes to investigate more advanced maps, the user level of the software may be changed as shown below. Simply put, the higher the user level selected, the larger the number of maps that are displayed.
Note that the number of maps displayed only changes on ROMs that are opened after changing the user level. Views of currently open ROM files will not change until the ROM file is closed and then re-opened. 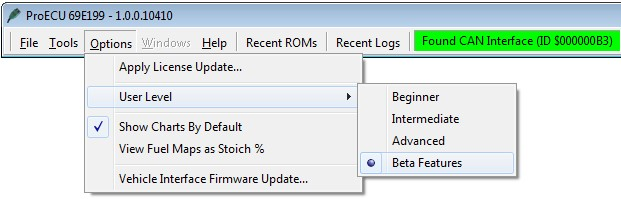
Map Types
Map Interpolation
At this point, it is worth mentioning interpolation. It is rare for the input to a 2D or 3D map to exactly match one of the scale values. If the input value exactly matches a scale value, then the corresponding output value is the result. However this does not often happen – it is more likely that the input value will lie somewhere between two of the scale values.
Interpolation smoothes out sharp steps between map values and allows smaller numbers of rows and columns to be used, reducing map size and complexity for editing.
3D Maps
Like 2D Maps consist of a table of values. However, 3D maps are different because they may have any number of rows and columns. This is because the output value of a 3D maps is based on two inputs rather than one. A good example of a 3D maps is the high octane ignition map. The ignition timing used is based on engine RPM and also on engine load 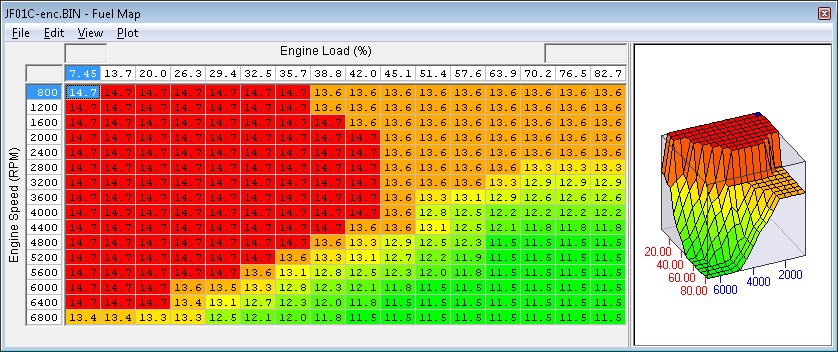
Scale Data
The input values of a 3D map are known as scale data. A 3D map has both an X and a Y scale. The ECU uses the X & Y scales to determine from which row and column intersections a data value will be retrieved.
Typically the scales are engine load across the top left to right and RPM at the side from top to bottom.
Map Data
The output values of a 3D map are known as the map data. The map data always has the number of rows and columns to equal the X and Y scales. Each value within the map data is known as a zone.
2D Maps
2D Maps consist of a table of input and output values. The ECU uses an engine parameter, such as current Engine RPM, to choose a value from the map. I.e. based on the input value, one of the output values is chosen. A 2D map always has 2 rows, but may have very many columns. A good example of a 2D map is the ECU's boost limit map. The boost limit (sometimes called Fuel Cut) varies according Engine RPM and is based against Engine Load (similar to Airflow). The current Boost Limit is relative to the current Engine RPM.
Scale Data
The input values of a 2D map are known as the scale data. This is the left row of values (shaded in grey). The ECU uses the scale data to choose from which columns the output value will be retrieved.
Map Data
The output values of a 2D map are known as the map data. This is the right row of values (no shading).
Example:
The Scale Data values are required so the ECU can choose the correct Map Data. So at 1600 RPM we can see the Boost Limit is 1.35 bar. 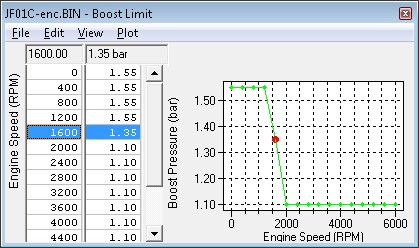
Data Values (1D Maps)
These are the simplest of maps. They contain 1 or more fixed values that the ECU uses. A good example of this is the Rev Limit map. This map consists of a single data value at which the ECU will cut the fuel injectors. 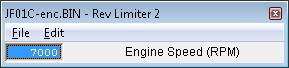
Viewing Map Data
Values in the maps are shown are all real values so an Ignition table is filled with true Ignition degrees Before TDC. A minus value (-5) shows an Ignition value after TDC.
Selecting a Data Point
To select a data point, simply click on that point using the mouse. The map value of the selected zone will be highlighted and displayed just above the top right of the map. Once a zone is selected the cursor keys can be used to move around the map to view values in other zones. You can also select an area of a map by using the standard windows function of 'Click and Hold' then moving the mouse.
Coloured Map View
All 3D maps are coloured by default. The colouring can be changed using the 'View' menu by selecting 'Clear Colouring'.
After changing a value or several values always choose 'View' and 'Show Map Coloured' to see a possible error in your changes. The 'Show Map Coloured' can quickly show errors if the colouring has been turned off, as shown below: 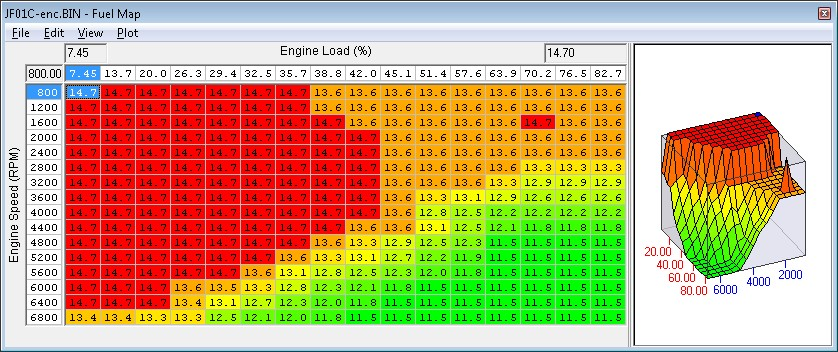
Viewing Maps Graphically
The graphing can be turned off from the main ProECU under the 'Options' menu: 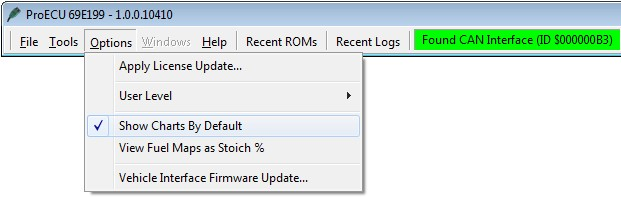
Maps can be viewed graphically by clicking on the 'plot' menu of any map. This brings up a plot of the map. Every zone of the map will be plotted on the chart. This gives a 'contour' view of the map. The colours of the table are represented in the same area on the graph.
Clicking on or near any data point on the chart will highlight that value, both on the chart and on the map data. Again, cursor keys can be used to move around the map.
3D Map Viewing Special Features
Resizing
3D and 2D Maps may also be resized using the usual Windows function of resizing by grabbing the edge of the window to allow high resolution viewing of Graphs.
Rotating
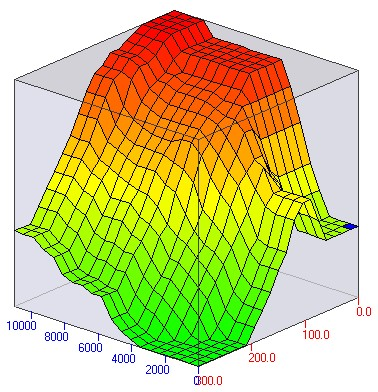 3D maps can be rotated to allow the optimal viewing angle of the map. The viewing angle may be changed by 'Left Click and Hold' and then Dragging the mouse which will rotate the graph.
By 'Right Mouse Click' it is also possible to 'flatten' the Graph (taking an overhead view) which will show a highlighted point on the map highlighted on the graph.
'Left Click and Drag' will bring the graph back into shape again.
3D Graph View
Fewer and More Significant Figures
CTRL+ALF+F ; CTRL+ALT+M
The size of the map window can be reduced by decreasing the number of significant digits displayed in the table. The values stored in the table aren't modified, only the way those values are displayed is modified.
This can be done either through the menus, or by pressing Ctrl+Alt+F for fewer significant figures, or Ctrl+Alt+M for more significant figures. 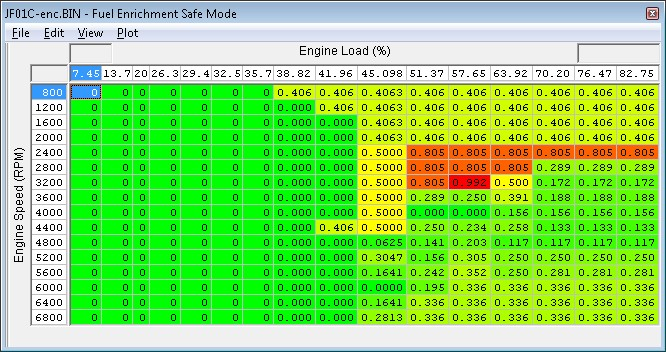
3D Map with More significant figures 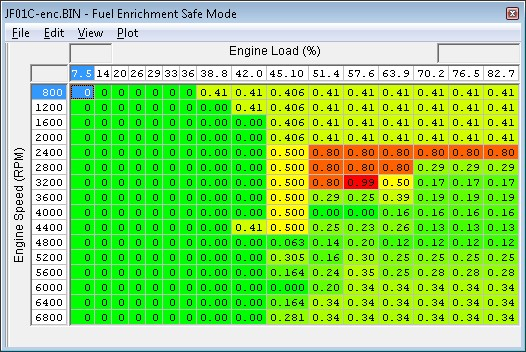
3D Map with Fewer significant figures
Editing a ROM File
Editing of a ROM file must begin from the ROM editor window. As with viewing maps, simply tick the checkbox next to the map that you wish to edit, and it will be displayed on the screen.
Altering Map Values Directly
Map values may be edited directly by clicking on the zone to be edited and pressing F2 – just like standard spreadsheet programs. Enter the new value and press enter to save the value into the map. Alternatively, you can keep the cursor in 'direct edit' mode by entering a value and the pressing any of the arrow keys to move onto the next cell to edit. Hitting escape whilst editing aborts the changes made to that zone.
Altering a Range of Map Values
Various modifications may be done to a rectangular area of map (irregular shaped areas must be modified in rectangular portions). In order to do this, select an area of the map either with the cursor keys or the mouse:
- Using the mouse, click hold the mouse button on the top left corner of the area to be selected, then drag the mouse to the bottom right corner of the area and release the button. The area will now be highlighted in blue.
- Use the cursor keys to move to the top left zone of the area to be selected. Hold down the shift key and move to the bottom right corner of the area, then release the shift key. The area will now be highlighted in blue.
Adding and Subtracting from Map Values
The '+' and '-' keys may be used to quickly add and subtract values from a selected area of the map.
Abandoning Map Changes
All altered values may be abandoned by selecting 'Abandon changes' from the 'edit' menu. Selected values may be abandoned by right clicking on the selected area and selecting 'Undo Changes'.
Keyboard Shortcuts
F2 | Edit value directly | Ctrl-Z | Undo all changes (highlighted) |
Enter | Save entered value to map | Ctrl-C | Copy highlighted cells to clipboard |
Escape | Cancel entered value | Ctrl-V | Paste cells from clipboard |
R or + | Add 1 to selected values | Ctrl-P | Scale selection by % |
F or - | Subtract 1 to selected values | Ctrl-A | Add value to selection |
T | Add 16 to selected values | Ctrl-F | Fill value with selection (similar to F2) |
G | Subtract 16 to selected values | Ctrl-I | Interpolated fill selection |
Y | Add 256 to selected values | Ctrl-H | Horizontal Interpolated fill selection |
H | Subtract 256 to selected values | Ctrl-V | Vertical Interpolated fill selection |
U | Add 4096 to selected values | Ctrl-Q | Close Window |
J | Subtract 4096 to selected | Ctrl-S | Commit changes to ROM (while in map) Save ROM file (while in map selection) |
values
Copy & Paste
Standard windows copy & paste functionality may be used with map data. This allows map data to be duplicated and also imported & exported with programs such as Microsoft Excel.
Copying
CTRL-C
Simply highlight a range of cells. Right clicking on the selection will then bring up the copy option. Selecting copy will save the data to the windows clipboard.
Pasting
CTRL-V
Highlight a range of cells that are to receive the data currently on the clipboard. Right click the area and select paste.
Copy/Paste Entire Map To/From Clipboard
Where several maps are the same this is a useful function for copying the entire map (including the RPM scale changes and engine load changes) quickly from one map to another. 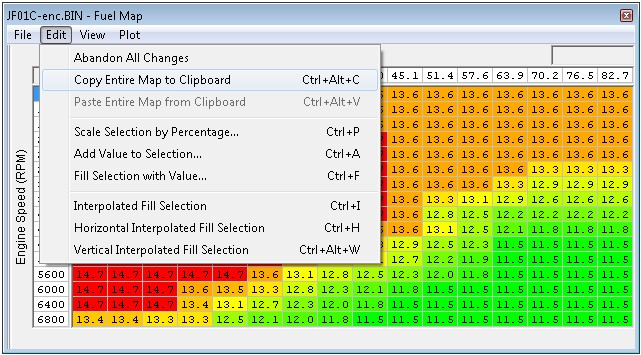
Altering Scale Values
Some scale values may be altered in the same way as map values.
It is sometimes necessary to scale the load zones of fuel & ignition maps when running higher boost. When running higher than standard boost, the load can exceed the highest load column of some maps. At this point, it is necessary to alter the map scaling. Once the columns have been rescaled, it is then necessary to alter the contents of the zones to match.
Block Editing Functions
Scale Selection by Percentage
CTRL-Percentage 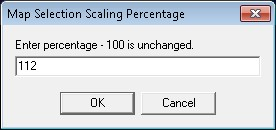 This allows an area to be scaled. E.g. to 50% or 150% of the original value. This retains the shape of the map, but changes the magnitude of the values.
Add Value to Selection
CTRL-Add 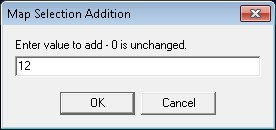 This allows a value to be added to each zone of the selected map area. Example entering the value of 7 will add 7 in decimal to every value that is selected.
Fill Selection with Value
CTRL-Fill 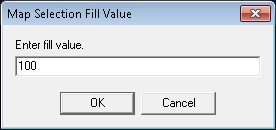 Fills all selected zones with a single value. Entering a value of 5 will fill all selected values with the decimal value of 5.
Interpolated Fill Selection Functions
All interpolation functions are available from the 'Edit' menu of every open map editor window.
3D Interpolated Fill Selection
CTRL-Interpolate 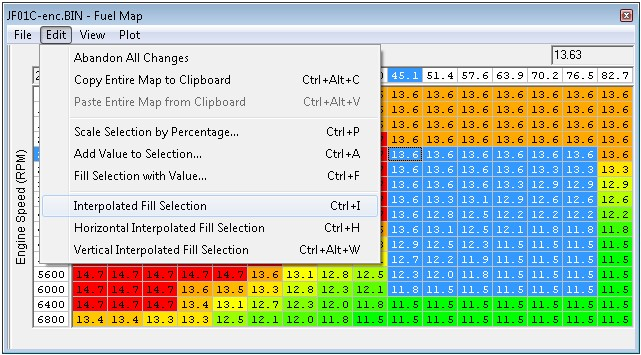
The selected area of the map is filled with values interpolated from the four corner values. This is useful for quickly 'shaping' areas of maps for fuelling that require smooth progressions.
Horizontal Interpolated Fill Selection
CTRL-Horizontal
The selected area of the map is filled with values interpolated from the left and right most columns of data. This feature interpolates each row of data separately. This feature is useful for profiling maps such as wastegate duty, where the values have an uneven progression vertically, but are progressive horizontally for throttle position.
Vertical Interpolated Fill Selection
CTRL-Vertical
The selected area of the map is filled with values interpolated from the top and bottom rows of data. This feature interpolates each column of data separately.
Two Stage Editing Process
Committing Changes
To commit all changes made in a map editor window to the main ROM file, select 'Commit Changes to ROM' from the 'File' Menu of the map editor window.
Until changes to a map are committed, the changes remain highlighted with a red border as shown below. This makes it easy to see what has been changed. To see the original value, 'Left Click' as shown below. 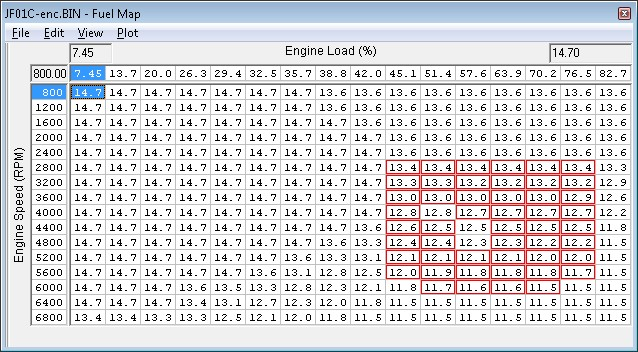
Before saving a ROM file, these changes should be committed. This feature is designed to highlight inadvertent changes that could potentially cause trouble later on.
Saving Changes back to Disk
Once all changes to be kept have been committed, the ROM file may then be saved to disk. To save changes to disk, select 'Save' or 'Save as' from the 'File' menu of any open ROM editor window. Once all changes to be kept have been committed, the ROM file may then be saved to disk. It is possible to choose 'save ROM file' or 'save ROM file as' without having 'committed changes to ROM' previously. ProECU will automatically 'commit all changes to ROM' from all modified Maps before saving the ROM file.
It is recommended that a consistent naming convention be adopted so that files may be easily identified. It is wise to leave the type of ECU (such as JF01C) in the name, since ROM files can only be programmed into the type of ECU from which they originate. It is useful to save a .TXT file with all the ROM details and modifications to the vehicle that this ROM was calibrated for.
DO NOT OVERWRITE any original standard ROM file; always give modified ROM files a new name.
(+44) 1895 811200 When dialing from within the UK, the country code is not required so dial 01895 811200 Open Hours Monday to Friday 9:00am - 5:00pm BST (UK Time) (4am-1230pm Eastern Standard TIme US) Visitors by appointment only EcuTek Tehnologies Ltd.Contact Us:
8 Union Buildings
Wallingford Road
Uxbridge, UB8 2FR
England
VAT No: GB 235 2616 23